Back to top
Navigate to Accounting Reports
In Toast Web, navigate to Reports. Using the reports navigation on the left-hand side of the screen, select Accounts to open the drop-down and choose the report you'd like to view.

Back to top
Breakdown of Accounting Reports
Accounting Overview
The Accounting Overview report allows you to easily view and print an overview of all your key financial information. This report is helpful in addressing the following questions:
- What items collected no tax that were not tax exempt?
- What percentage of business is third-party delivery?
- What percentage of business is dine-in vs takeout?
- How much tax did I pay for each tax rate?
- How much tax have I paid per sales category?
- How do I see a breakdown of each discount and what percentage each adds up to?
You can access the Accounting Overview report to view the following tabs:
- Sales Summary: Displays the summary of your restaurant's key sales numbers categorized by Sales Top Numbers, Sales Categories, and Deferred Sales
- Revenue Centers: Display your restaurant's sales numbers by revenue centers
- Dining Options: Displays breakdown of your restaurant's sales by dining options (i.e. Dine In, Take Out, Employee Meal, Delivery, etc.)
- Dining: Displays all discounts used
- Taxes: Displays overview of your taxes
- Payment Summary: Displays summary of payment transactions
- Service Charges: Displays summary of service charge applied
After selecting Accounting overview from the left-hand reporting menu in Toast Web, you'll be asked to select a date range. If you have more than one location, pick which locations you'd like to be included in this data. After selecting Submit, you'll see your Accounting Overview report.

You can find quick, generalized information on the Sales Summary tab of this report, but don't forget to check out the other tabs at the top for different ways to view your financial data.
Back to top
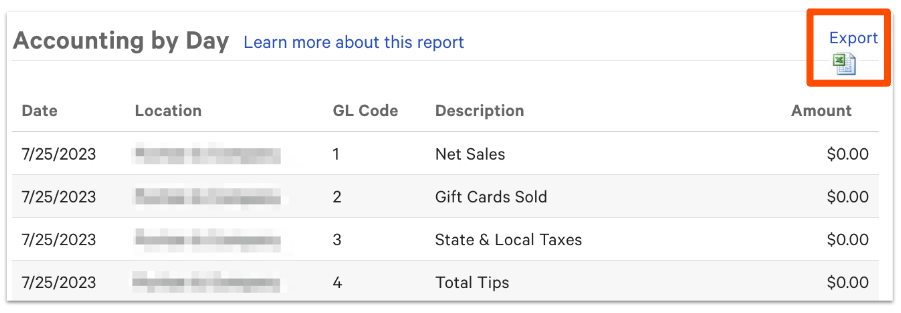
Accounting by Day
The Accounting by Day report provides a breakdown of revenue by GL code for each day within the report range. This report can be exported directly to Excel or another spreadsheet program using the icon in the top-right corner.
Back to top
The Accounting by Location report provides a breakdown of revenue by GL code for each location selected within the report range. This can also be used to generate a report that contains information that you might otherwise have to get from multiple separate reports in Toast. For instance, if you wanted a single report that showed you both your cash deposit and your credit card deposit in one place, the Accounting by Location report could be set up to accomplish that. This report is typically used by accountants and bookkeepers to track daily journal entries and have them in one place. This becomes helpful when making entries into external accounting software, like QuickBooks.

Back to top
General Ledger Accounts
Selecting this report will take you to the Accounting Report Setup page in Toast Web, where you can create and map your GL codes. To learn more, read this Toast Central article: Create and Map General Ledger Codes for Toast POS.
Back to top
Accounting Report Discrepancies
If you discover an incorrect figure on one of your accounting reports, use the Sales Summary, the Order Details report, and/or the Payments reports to locate any discrepancies. If you believe that the discrepancy lies in the credit card fees, please contact Customer Care.
Back to top