With Toast, you have access to robust, real-time reporting on your business. Continue reading to learn about the different types of reports and how to navigate them.
In this Article:
In Toast Web, navigate to the Reports section using the navigation on the left side of your screen. This will bring you to your reporting dashboard, the Weekly Overview, which can help you monitor your restaurant's performance in four key areas: sales, labor, guest counts, and menu performance. To learn more, visit this Toast Central article: Toast Reporting Dashboard: Weekly Overview.
All other reports can be accessed by selecting the arrow (>) to open the report navigation on the left side of the screen.
Back to top
The various types of reports we have are listed below, including links to Toast Central articles that describe these reports in greater detail.
| Category | Description |
|---|
| Sales Reports |
These reports provide key sales metrics, a breakdown of sales by day, day of the week and time of day, payment types, and sales categories.
For more information, please see Sales Reports Overview.
- Sales Summary: The single place to view locations' net sales and labor costs together over a period of time (e.g. year over year, month over month). Please see Sales Summary Report Overview for more information
- Sales Analytics Report
- Sales Breakdown Report
- Digital Order Sources Report
- Orders Report
- Order Details Report
- Paid in Total Report
- Deposit Sales Collected Report
- Location Breakdown Report: Please see Locations Reports Overview for more information.
- Group Sales Overview Report
|
| Labor Reports |
These reports provide vital information on all labor-related items including hours worked, pay, tips, and time entries. Labor reports can be customized based on dates, shift hours, and to view all employees or individuals.
For more information, please see Labor Reports Overview.
- Labor Cost Breakdown Report
- Time Entry Management Report
- Time Entry Reporting Report
- Hourly Sales Report
- Employee Productivity Report
- Labor Summary Report
- Manager Swipe Card Log Report
- Location Overview Report: Please see Locations Reports Overview for more information.
- Shifts Report
- Pooled Tips Report
- Break Entries Report
- Break Adherence Report
- Time Entries Audit Report
|
| Menus Reports |
These reports provide a quick view of your top-performing menu groups, items, and modifiers and a new product mix breakdown. You can select different menu types (Menu Items, Open Items, Modifiers, Toast Cards, and Special Requests).
For more information, please see Menu Reports Overview.
- Product Mix Report
- Menu Breakdown Report: Please see Special Requests Reporting.
- Top Menu Items Report
- Top Menu Groups Report
- Top Modifiers Report
- Item Details Report
- Modifier Details Report
- 86 Report
- Food Waste Breakdown Report
|
| Payments Reports |
The payments reports (also referred to as finance reports) help you take a look directly at the activity going into and out of your bank account linked to Toast.
For more information, please see Payments Reports Overview.
- Payments Report
- Payout Overview Report
- Reconciliation Report
- Processing Statements Report
- Chargebacks Report
- Settled Deposits Daily Breakdown Report
- Deposits Total Overview Report
- Daily Card Activity Report
- House Accounts Transactions Report
- Gift Card Balances Report
- Gift Card Balances Reports (see Gift Card Reports Overview)
- Gift Card Transactions Report
- Inactive Gift Cards Report
- Failed eGift Card Delivery Report
- Billing & Invoices Report
|
| Cash and Loss Management Reports |
These reports give you insight into the cash and cash drawer activity going on in your restaurant on a single day. If you have multiple locations, you'll also be able to see cash activity across all locations on a single day.
For more information, please see Cash and Loss Management Reports Overview.
- Cash Drawer Reports: Please see Cash Drawer Reports Overview for more information.
- Cash Activity Audit Report
- Cash Drawer Overview Report
- Drawer History Report
- Voided Orders Report
- Removed Items Report
- Loyalty Misuse Report
- Discounts Report
- No Sale Report
- Unpaid Orders Report
- Refunds Report
- Voided Payments Report
- Tax Exempt Report
- Offline Payments Report
- End of Day Report
- Check Sequence Log Report
|
| Accounts Reports |
These reports will show you your finances for the day, week, year, or across multiple locations at a glance. You can also view your GL codes and House Accounts.
For more information, please see Accounting Reports Overview.
- Accounting Overview Report
- Accounting By Day Report
- Accounting By Location Report
- General Ledger Accounts Report
|
| Kitchen Operations Reports |
If you use the Kitchen Display System, use these reports to see the amount of time it takes to fulfill orders, which prep stations take the most time or get the most traffic, and detailed information about all kitchen tickets.
For more information, please see Kitchen Reporting Overview.
- Tickets by Fulfillment Report
- Tickets By Hour Report
- Ticket Details Report
|
| Marketing Reports |
These reports provide information about customers who have visited your restaurant, contact information via digital receipts, rewards activity, and gift card activity. This data will allow you to manage a more direct marketing strategy with your customer base and view who your most loyal customers are.
For more information, please see Marketing Reports Overview.
- Guest Feedback Report
- Guest Summary Report
- Guest Credits Report
- Rewards Accounts Report
- Rewards Transactions Report
- Fundraising Breakdown Report
|
| Other reports |
- Reservations & Waitlist
- Guests Report
- Bookings Report
- Location Reports: These reports are located in the Labor and Sales section. For more information, please see Locations Reports Overview.
-
- Location Overview Report
- Location Breakdown Report
|
Back to top
Depending on the type of report you're viewing, there are different types of filters that currently exist in Toast Reporting.
Back to top
This filter type can be found in most reports. There are several parameters you can customize on reports, including the following:
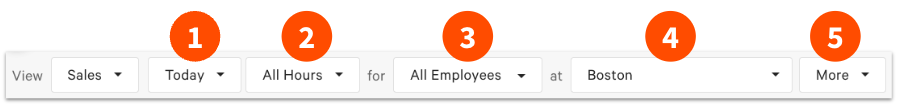
- Time frame: You can filter by day, week, month, or a custom date range.
- Hours: You can filter by pre-set time frames or a custom hour range.
- Employees: You can filter by all employees or specific individual(s)
- Location: If you have more than one location, you can select one or multiple locations to run a report
- More: If applicable, add additional filter options for your report. In the example below, a Dining Options filter was added, and the report was further filtered to the Take Out dining option.
| When making any changes to a report filter, always select Update. This will refresh the report with your new settings. |
Some reports will show an updated look for basic filters, but with similar functionality:
Analytics pages give you high-level insight into your data by providing a comparative breakdown. For example, the Sales report:
With this comparative filter, you can see three options to toggle between:
- Sales Report would run a standard report in a set time frame with any specified locations (if applicable)
-
Compare Dates allows you to choose two date ranges. Set the first date range and compare it either to the same time frame in the previous year, or the previous period (e.g. if you're running a report on this week's sales, you can run a comparison report against the previous week).
-
Compare Locations is available for restaurants with more than one location. Here you can choose a single time period and compare the performance of different locations.
Note that for both Compare reports, the resulting charts will be color-coded. The first date or location will be blue and the second date/location will be orange.
Back to top
Many reports provide you the option to add or remove data by customizing the columns that appear on your report. Select Show/hide columns at the top of a report table for a list of additional data you can display.
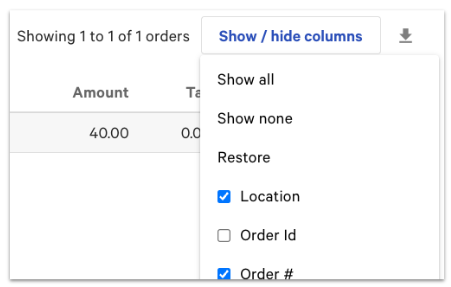
The Restore option will return the columns to their standard configuration. Any changes made to columns on the report will reflect on downloaded or exported report data.
Back to top
You can export many of your reports to share or save your data. Depending on the report, you can either download the data or email yourself or others a file.
If you don't see the Email Export or download buttons as described below, then the report cannot be downloaded.
Back to top
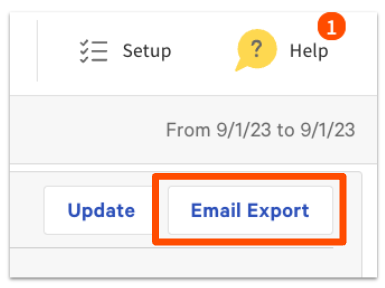
For reports that allow you to email a report file, select the Email Export button in the top right corner of the report.
You can then enter as many emails as needed to receive a copy of this report. Separate each email by a comma, and select Submit.
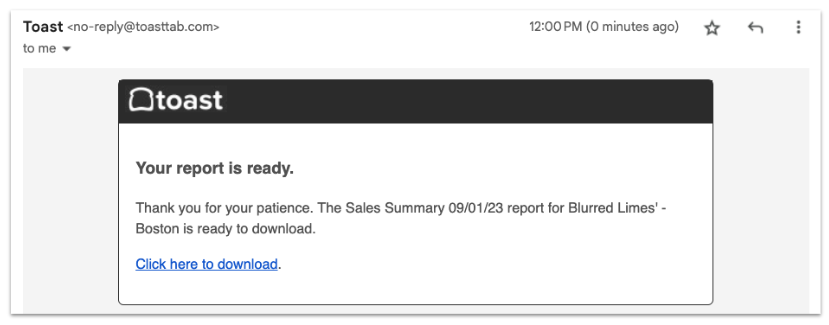
The recipient will get an email with a download link to the report. The file can be downloaded as a .xls or .csv, depending on the report.
Other reports will have a blue, green, or gray download icon in the upper right corner:
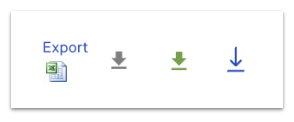
Downloaded files can be opened in Excel or imported into your preferred accounting software.
Back to top
Reports can also be saved as a printer-friendly PDF by using the Print function in the web browser (Toast recommends using Google Chrome).
- Select File > Print.
- Set the Destination to Save as PDF and select Save.
Note: If the print preview shows that the report is getting cut off from the page, you can select More Settings, set the Scale to Custom and adjust it to 49 (or until the entire report becomes visible in the preview). Select Save. You can also try zooming out the view in your browser by navigating in Chrome to View > Zoom Out.
Below are links to some additional Toast Central articles related to reports. Not seeing what you're looking for? Use the Toast Central search to find other articles by keyword.