Note: These reports are for customers with the Kitchen Display System (KDS) only. If your kitchen operates using printed tickets, these reports will have no data.
In this Article:
Kitchen Operations Reports Introduction
The kitchen operations (KDS fulfillment) reports allow you to view the amount of time it takes from when a chef receives an order on a KDS, to when they complete the order on the KDS, and through the point at which an expediter delivers the food items to the table or to the hands of a server.
See the table below for all available kitchen operations reports:
|
Reports
|
Description
|
Why Should I Use This?
|
|---|
|
Tickets by Hour
|
Provides a high-level view of the number of tickets fulfilled in a given hour, as well as the average time taken to complete those tickets.
|
This is a good measure of how busy the kitchen is.
|
|
Tickets by Fulfillment Time
|
Breaks down how many tickets were fulfilled by each station within a set time interval.
|
Helps provide insight into how your kitchen is handling the workload within a specific amount of time. Measures ticket turnaround time.
|
|
Ticket Details
|
Deep-dive breakdown of the details of each individual kitchen ticket.
|
Shows what happened on a specific ticket and when (from the kitchen's point of view).
|
Back to top
Navigating to Kitchen Reports
In Toast Web, navigate to Reports. Using the reports navigation on the left-hand side of the screen, select Kitchen operations to open the drop-down.
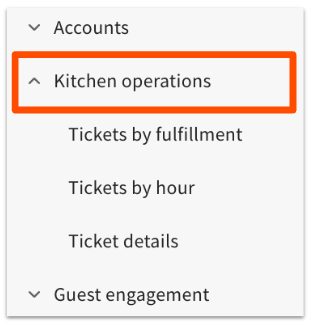
The following kitchen display/fulfillment reports are available:
- Tickets by fulfillment
- Tickets by hour
- Ticket details
Back to top
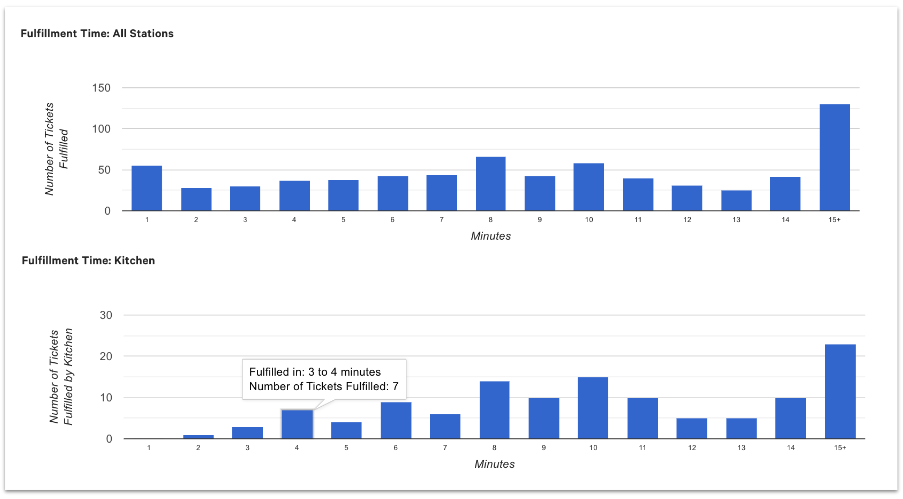
This report breaks down how many tickets were fulfilled by each station within a set time interval. In the example below, you can see how the number of tickets per time interval across all stations compares to the number of tickets per fulfillment time at the Kitchen station specifically.
Back to top
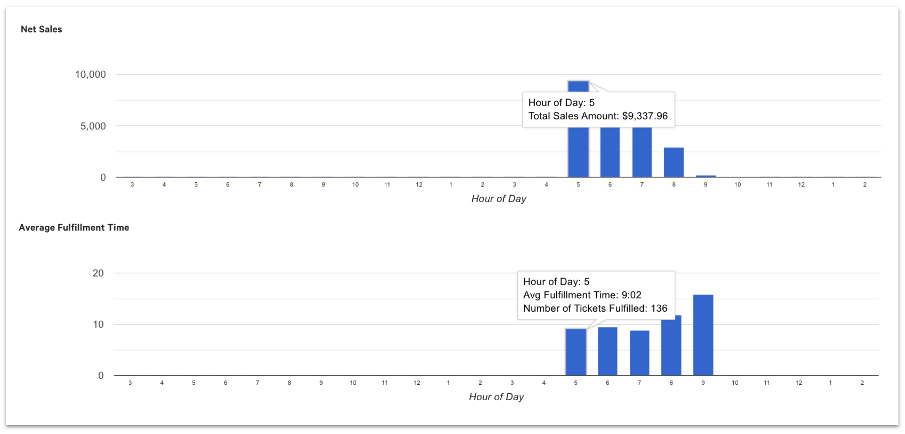
This report provides charts with the following data:
- An hour-by-hour readout of net sales hour over hour
- The number of tickets fulfilled in a given hour
- The average time taken to fulfill kitchen tickets
Back to top
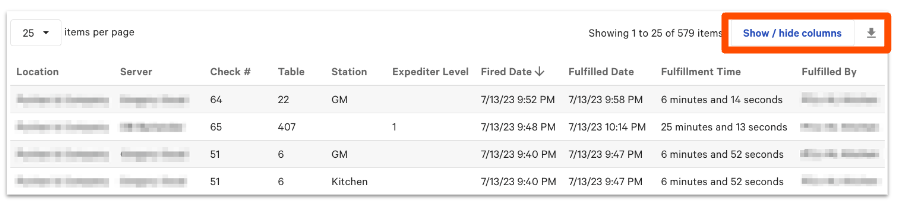
This report shows more detailed information for individual kitchen tickets. You can customize which data will appear in the report by selecting options from the Show / hide columns button.
This report can be exported as a .csv file.
Back to top