In this Article:
Menu Reports Introduction
This six-minute video will explain how to unlock the secrets of menu engineering to analyze and improve your menu items and increase your restaurant's profit. Learn about key concepts of menu engineering, such as profitability and popularity, and how to calculate crucial restaurant metrics. Also, learn how to analyze insights from your menu’s data to make informed decisions when engineering your menu items.
Toast's menu reports provide an in-depth look into how your menu is performing. View your top sellers, break down your sales by menu, group, and item, and more. Many of these reports even allow you to view periods of hours within a specific day by updating the All Hours drop-down menu (perhaps you want to view a specific item's sales over a certain period of time). The following reports are available:
|
Available Reports
|
Description
|
|---|
|
Product Mix (PMIX)
|
Day-to-day breakdown of menu items sold, including item tag filtering
|
|
Product Mix Compare
|
Compare menu, group, and item performance across multiple locations. This only applies to multi-location restaurants.
|
|
Menu Breakdown
|
View your menu the way you want, either via the menu hierarchy or by sales category, and what modifications were made to your menu.
|
|
Top Menu Items
|
View top-performing items
|
|
Top Menu Groups
|
View top-performing menu groups and find what categories are most popular
|
|
Top Modifiers
|
View top-performing modifiers
|
|
Item Details
|
Provides a detailed view of menu items for analysis
|
|
Modifier Details
|
Provides a detailed view into modifiers (no sales data) for analysis
|
|
86 Report
|
Quick look at what items are marked out of stock. This is helpful to see what to reorder.
|
Back to top
Navigate to Menu Reports
In Toast Web, navigate to Reports. Using the reports navigation on the left-hand side of the screen, select Menus to open the drop-down and choose the report you'd like to view.
Back to top
Breakdown of Menu Reports
| In Ireland and the U.K., the Product Mix (PMIX) report has an updated gross sales calculation based on customer feedback. Gross sales shows your total revenue including VAT, after any refunds and discounts, while Net sales shows your revenue after VAT, refunds, and discounts are taken out. |
The Product Mix (PMIX) report breaks down sales for the selected date range, organized by menu, menu group, and item. It can also give you a sum total of the number of items sold within a given time period.
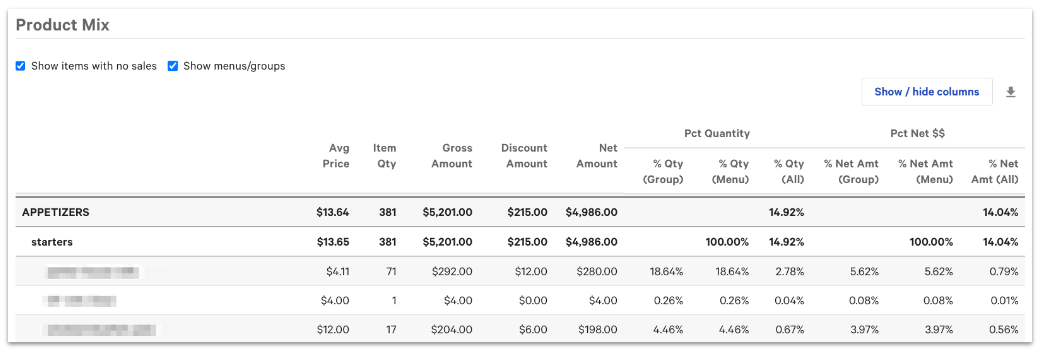
Note that you can deselect Show menus/groups to only view menu items. You can also deselect Show items with no sales to view only items that have been sold for the time frame you've chosen.
The PMIX report can be downloaded for one month of data at a time. Currently, there is no option to automatically email a daily PMIX report.
| This feature is currently not available to Customers who use Toast Retail, Toast Multilocation Management (MLM) or xtraCHEF. |
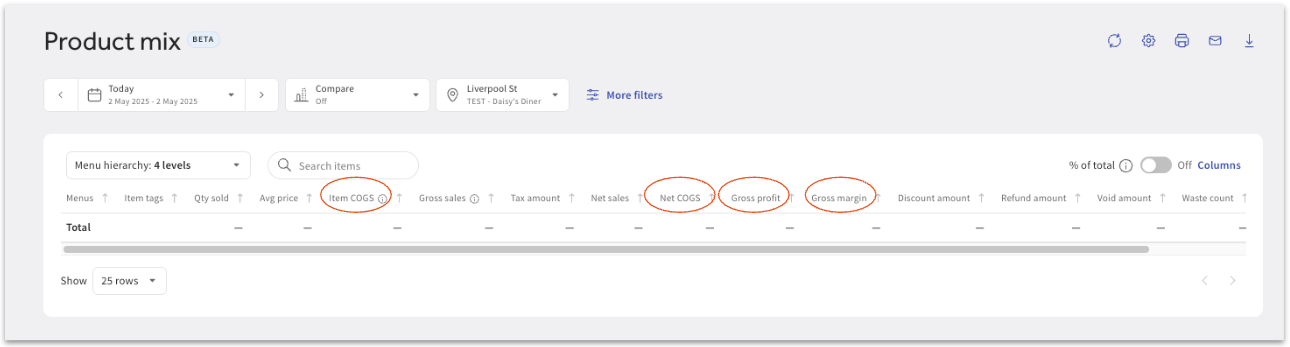
Note: The Product Mix (PMIX) will show additional columns, based on the Cost calculation entered at the menu item level in the Menu Builder. If there is an amount entered in the Cost field, these amounts will be included in the PMIX calculations under the following columns within the PMIX report:
- Item COGS
- Net COGS
- Gross Profit
- Gross Margins
If you did not populate the Cost field, these calculations will remain blank. You can also choose to hide these columns by selecting the Show/Hide columns option on the top right hand side of the report.
Back to top
The PMIX Compare report is available for restaurants with more than one location. Select which locations you'd like to compare and select Update. You'll then be able to compare a breakdown of sales (item quantity and percent quantity (group) in a selected date range.
Back to top
The Menu Breakdown Report lets you see what customers order by providing a quick view of your top-performing menu groups, items, modifiers, and a product mix breakdown. Start by selecting a date range, your desired performance information (sales category or menu), and a location.
Note: The Menu Breakdown report will populate data up to 1 hour from the current time. This means if you pull a report for the current day at 11:00 a.m., the data reflected in the report will be from the current day up until 10:00 a.m.
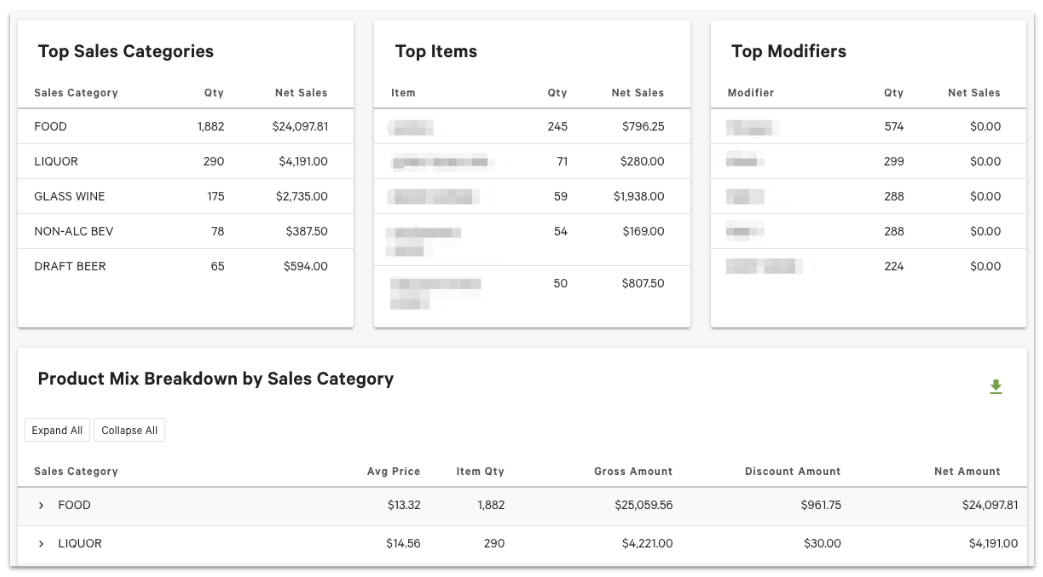
- Top Groups, Top Items, and Top Modifiers: These tiles will automatically identify the top 5 menu groups, items, and modifiers based on the quantity sold for the dates, locations, and menu types selected.
- Product Mix Breakdown by Menu or Sales Category: This table allows you to explore your menu or sales category's performance at the group, item, and modifier level.
Back to top
The Top Menu Items report allows you to view data at the item level and sort columns by either ascending or descending order. You can see the average price, quantity ordered, the gross amount earned from those sales, the amount (if any) that was discounted, and the net amount made after discounts. Select any column header to sort from least to greatest (or vice versa).
You could use the Top Menu Items report if you wanted to look at total item sales by employee. Select your desired date range and employee from the drop-down menus, and then select Update to run your report.
Back to top
The Top Menu Groups report allows you to view data at the group level and sort columns by either ascending or descending order. You can see the menu group, menu, average price, quantity ordered, the gross amount earned from those sales, the amount (if any) that was discounted, and the net amount made after discounts. Select any column header to sort from least to greatest (or vice versa).
Back to top
The Top Modifiers report allows you to view data at the modifier level and sort columns by either ascending or descending order. You can see the average price, quantity ordered, the gross amount earned from those sales, the amount (if any) that was discounted, and the net amount made after discounts. Select any column header to sort from least to greatest (or vice versa).
Back to top
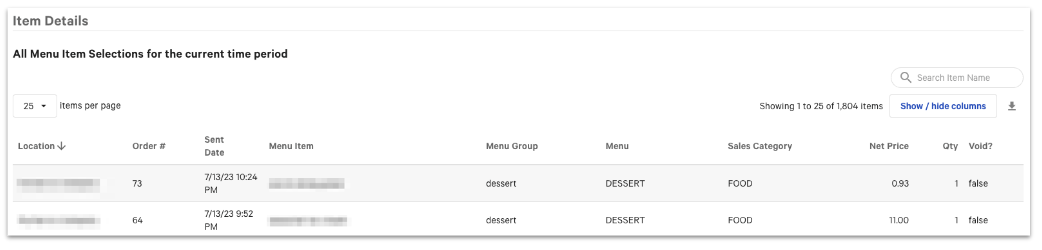
Looking to see what items a server rang in on previous checks? Want to find transactions for a specific menu item? The Item Details report provides a number of specific data points about each item ordered through Toast for the date range selected. This report differs from the other menu reports in terms of what data is included, because not all categories are related to sales figures. You can select any item on the report to view the order details.
Use the Show/Hide columns button to see other fields associated with your items, such as server, discount, tax, and more.
Back to top
The Modifier Details report provides a number of specific data points about each modifier ordered through Toast for the date range selected. This report differs from the other menu reports in terms of what data is included because not all categories are related to sales figures. You can select any modifier on the report to view the order details.
Back to top
The 86 report will show you all items that are out of stock or unavailable at your restaurant. Set the Threshold Value to different amounts and select Submit to see items that may be running low (e.g., only 5 chocolate muffins remaining). The report will show location, menu name, group name, item name, and quantity remaining.
Back to top
How can I view what items guests are adding modifiers to?
- Navigate to the Menu Breakdown report (Reports > Menus > Menu breakdown).
- Select Menu from the first drop-down, and then select Menu items and Modifiers from the second drop-down, as shown below.

- Scroll down to the Product Mix Breakdown by Menu section. Use the arrow to the left of the menu group and menu items to expand the table and view the breakdown.

Back to top