In this Article:
The Sales Summary is a commonly used report that shows detailed sales data for your chosen date range. To navigate there, you can select Sales summary from the Quick Actions section of your Toast Web homepage, or navigate to Reports > Sales > Sales summary.
This article will provide a high-level breakdown of key sections within the Sales Summary report, as well as tips for filtering and customizing the report to suit your restaurant’s needs. For an overview of how to navigate the updated Sales Summary report, you can view the video below:
Video overview of how to navigate the Sales Summary report.
Back to top
Above the report, you’ll see date and location filters. Use the drop-down menu to select from different pre-set options (yesterday, today, this week, etc.), or select Custom date to choose a specific range for your report.
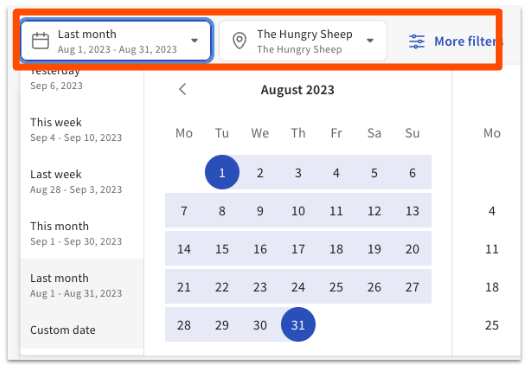
The report will update for pre-set date filters automatically. If you choose a custom date range, you’ll need to select Apply to update the report. There is no date range limit for this report.
Note: A Customer Care representative can change the first day of the week to start on Sunday or Monday for your reports (whichever you prefer), and can verify your start of the week if you're unsure of what it’s currently set to.
Next to these drop-downs, you’ll also see the More filters option, which will open up a filter menu on the right side of the screen with the ability to adjust your report for specific hours, days of the week, revenue centers, service areas, and more. For instance, you can filter the Sales Summary report to view sales from online orders only.
Note: The Sales Summary report breaks down orders and sales by service period or by custom hours. It records a sale when a check is first opened, not when the payment is processed. For example, if you filter the report by lunch service hours, which are set for 12:00 p.m. to 3:00 p.m., and a check is opened at 11:50 a.m., the sale will not appear in the filtered time range.
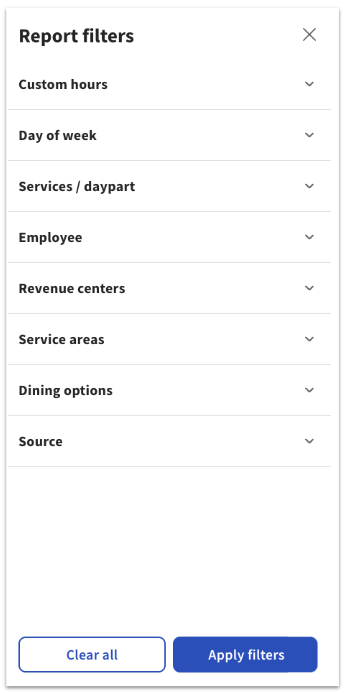
Select Apply filters to update the Sales Summary report with your selections. Clear all will allow you to remove all custom filters and go back to the standard report.
The gear icon in the top right corner of the page will open the Report settings configuration, which allows you to reorder the sections of the Sales Summary report to suit your needs.
Select Apply to confirm your configuration, or Reset order to go back to the standard report configuration.
Please note that the Sales Trends section at the top of the report cannot be moved and that your customizations will not carry over to other browsers, devices, or report exports.
Back to top
You can export the Sales Summary report via email or download the data as a CSV (Comma-separated value) or XLS (Microsoft Excel Spreadsheet) file. Select either the email icon or the download icon (down arrow) in the top right corner of the report, and choose your desired file type.
The data in the export will reflect any filters you have selected, but will not change based on any layout customization you’ve applied. The XLS export format will include one file with multiple sheets.
Back to top
The Sales Summary report includes multiple sections, or “cards”, that display different sales information for your selected date range.
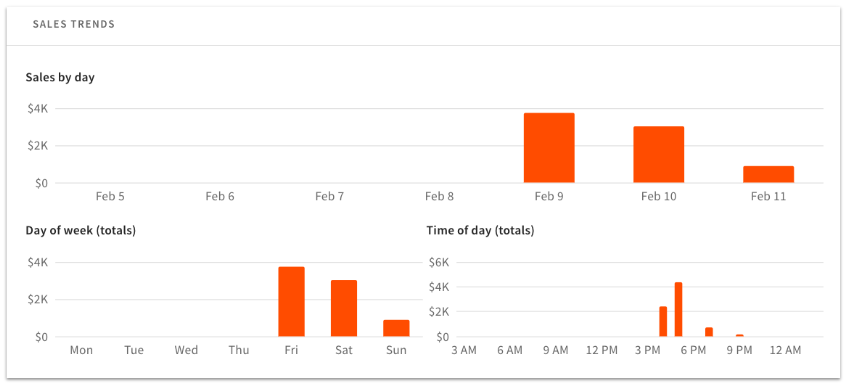
The Sales Trends section at the top of the report consists of 3 bar graphs that show sales by date, day of week totals, and time of day totals. Hovering over a specific bar on any of these graphs will show you detailed data for that time period.
Where applicable, cards will have a caret (arrow) icon that will take you to a more detailed report for the data within that section.
The other sections of the report (which can be reorganized as described in a previous section of this article) are described below:
|
Sales Summary Card
|
Description
|
|
Revenue Summary
|
Displays gratuity, tax amount, tips, deferred amounts, paid in total, and total revenue.
In Canada and the U.S., this card will show net sales (gross sales minus discount and refund amounts).
In Ireland and the U.K., this card will show gross sales (sales including value-added tax (VAT)).
|
|
Net Sales Summary
|
In Canada and the U.S., this card will display gross sales, discounts, refunds, and net sales.
In Ireland and the U.K., this card will display total sales, taxes, discounts, refunds, and net sales.
|
|
Tip Summary
|
If your restaurant has tip withholding enabled, this section displays tips collected, tips refunded, total tips, tips withheld, and tips after withholding.
If your restaurant doesn’t have tip withholding enabled, this section displays tips collected, tips refunded, and total tips.
|
|
Unpaid Orders Summary
|
Displays the total unpaid amount. This can also include orders that were overpaid, which would show up as a negative value. This card links directly to the Unpaid Orders report.
|
|
Sales Category Summary
|
Displays the number of items and sales amounts for the sales categories set up for your restaurant. It also includes figures for items sold with no sales category assigned. This card links directly to the Sales Breakdown report.
|
|
Revenue Center Summary
|
Displays the number of items and sales amounts for the revenue centers set up for your restaurant. This card links directly to the Sales Breakdown report.
|
|
Dining Option Summary
|
Displays the number of orders and sales amounts for the dining options set up for your restaurant. This card links directly to the Sales Breakdown report
|
|
Service/Daypart Summary
|
Displays the number of orders and sales amounts for each service period set up for your restaurant. It also includes orders taken outside of service hours (for example: eGift card online sales). This card links directly to the Sales Breakdown report.
|
|
Tax Summary
|
Displays the eligible net sales and tax amount for each of the tax rates set up for your restaurant. It also shows a summary of non-taxable sales.
For information on Marketplace Facilitator Taxes and how they affect your restaurant if you are integrating with third-party ordering platforms, check this Toast Central article, Understand Marketplace Facilitator Laws.
|
|
Service Charge Summary
|
Displays the count and amount (minus refunds) of each type of service charge that is set up for your restaurant. The amounts listed in this card do not include service charge taxes.
|
|
Deferred Summary
|
Displays the gross amount, discounts, refunds, and net amount for any deferred payments, like gift cards. This card will only appear if you have deferred sales for the time period selected.
|
|
Void Summary
|
Display the void amount, order count, item count, and amount % for the selected time period. This card links directly to the Voided Orders report.
|
|
Cash Summary
|
Displays expected closeout cash, actual closeout cash, overage/shortage amounts, expected deposit, actual deposit, and deposit overage/shortage. This card links directly to the Cash Drawer History report.
If you notice a difference in figures between the expected deposit and the actual deposit, this may be due to a cash adjustment in the form of a void, payout, or refund (learn more: Understand "Cash Adjustments" on Reports).
|
|
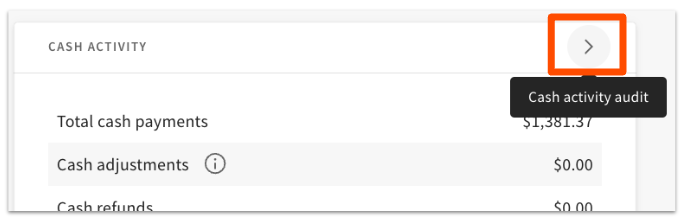
Cash Activity Summary
|
Displays total cash payments, adjustments, refunds, cash before tipouts, credit/non-cash tips, tips withheld, and total cash. This card links directly to the Cash Activity Audit report.
|
|
Payments Summary
|
Displays a table of each payment type (credit, gift card, cash, other) along with count, amount, tips, gratuity, tips/grat %, refunds, and total amounts. You can select the Columns button to adjust which information appears on the card. This card links directly to the Payments report.
The Payment Summary card on the Sales Summary report is where you'll be able to see total credit card tips for a given time period.
|
|
Service Mode Summary
|
Displays the net sales, total guests, average sales per guest, total payments, average sales per payment, total orders, average sales per order, and turn time for each service mode (i.e. Quick Service, Table Service) used at your restaurant. It also includes “% of total” calculations for each summary amount.
- Total Guests: Shows the total number of guest
- Total Payments: Shows the total number of payments made
- Total Orders: Shows the total number of orders placed
- Avg/Guest: Shows the average sales amount per guest
- Avg/Payment: Shows the average sales amount per payment made
- Avg/Order: Shows the average sales amount per order placed
The turn time for each service mode is included in the sales summary report while the individual table turn time can be viewed on the booking report, which is a feature of Toast Tables.
If you want to learn more about Toast Tables and how individual table turn times are calculated, please see the following articles:
|
Back to top
Tips are displayed in the Revenue Summary, Payments Summary, and Tip Summary sections of the Sales Summary Report.
In the Payment Summary, the dollar amount shown under Cash and Tips displays the total amount of cash tips declared by your employees during Shift Review.
These values in the Revenue and Payment Summary sections should match up and remain the same unless there are refunds or unpaid accounts:
- Total Gratuity received
- Total Tips received, including cash (matches to Tips collected in Tip Summary section)
- Total amount received
Back to top
Sales Summary Unpaid Orders
You can view any unpaid orders in the Sales Summary as well. However, if your Sales Summary for a particular date shows an unpaid order and no unpaid orders are displayed in View Unpaid Orders, please start a chat with Customer Support, who can help locate this unpaid order.
Back to top
Back to top