In this Article:
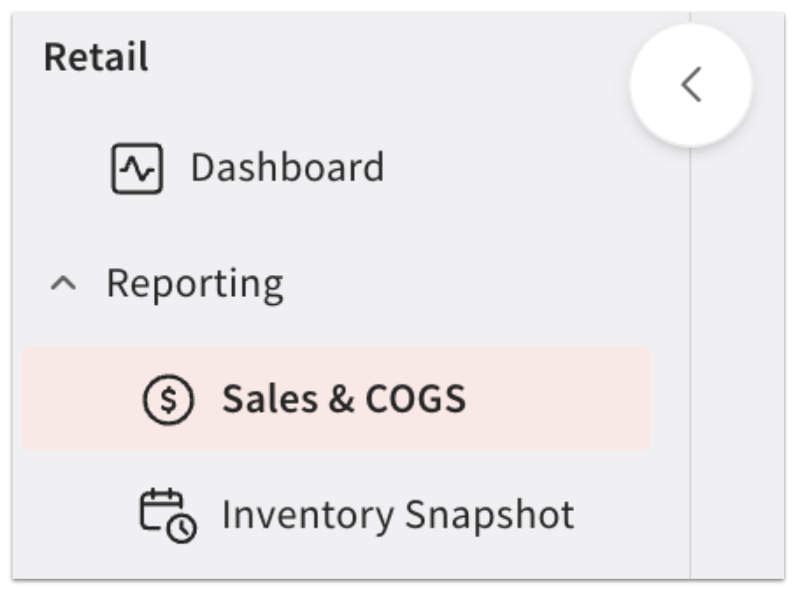
On the Toast Retail page within Toast Web, you’ll see your retail reports on the left-hand page navigation:
You’ll need the 4.1 Sales Reports admin permission in order to view report data for a location.
You can also access these reports from the Reports section of Toast Web by opening the left-hand reports navigation menu and opening the Retail drop-down.
- The Sales & COGS report will give you an easy way to look at sales for your retail business.
- Inventory Snapshot captures the current state of inventory, showing you ending price, ending quantity, inventory value, and inventory cost for a specific day.
- Inventory Roll Forward tracks all adjustments leading to the Inventory Snapshot, offering a historical and contextual view of all inventory adjustments.
Note: Toast Retail does not sync inventory data to or from xtraCHEF.
Back to top
The Sales & COGS report shows data for all of the items you have in the Toast Retail module, to help you understand profit for retail sales and compile your profit & loss data.
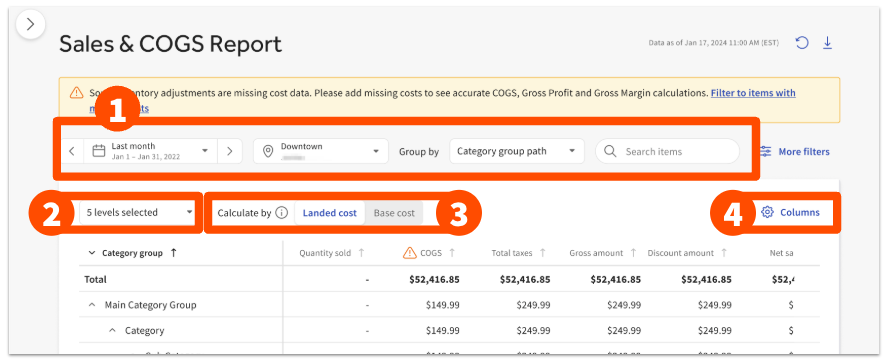
- At the top of the report, you’ll see filter and search options to help you narrow down the information displayed in the table.
- The date picker allows you quickly choose from commonly-used preset time ranges or select a custom date range. Note that the data in this report begins on January 1, 2023, or the date of your first retail sale (whichever is more recent).
- The Group by drop-down will default to Category group path, but gives you the option to change how data is organized in the table below. You can also choose Brand, Sales category, Supplier, or Revenue Center.
- The Search field works similarly to the Item Library search - you can enter a keyword or an exact item name to find the data you’re looking for.
- You can select More filters to further narrow down the retail category groups, categories, or subcategories you’d like to display (regardless of the selection you’ve made in the Group by drop-down).
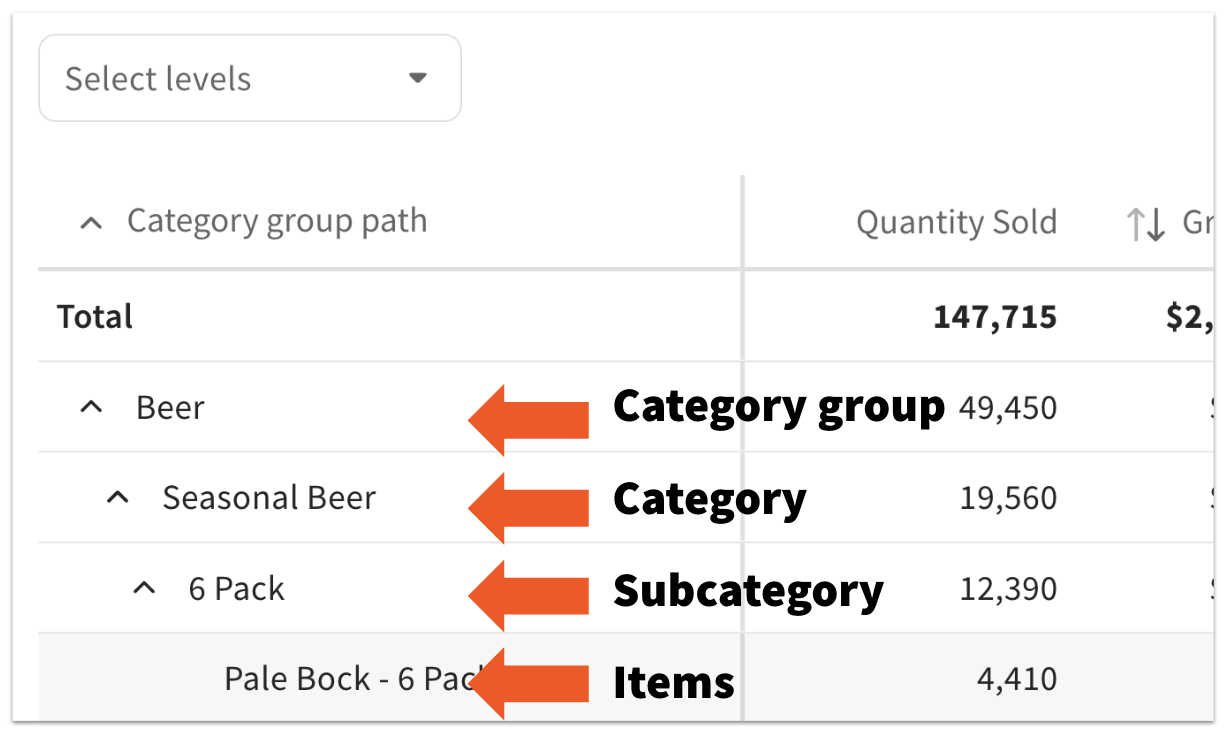
- The Select levels drop-down will update based on the selection you made in the Group by drop-down, and will give you control over how many levels of detail are displayed in the table. The default will always be to show all levels for your selected group.
- For example, if you’ve chosen to group by Category group path, you’ll see all category groups, categories, subcategories, variations, and item groups organized into a hierarchy that you can expand or collapse:
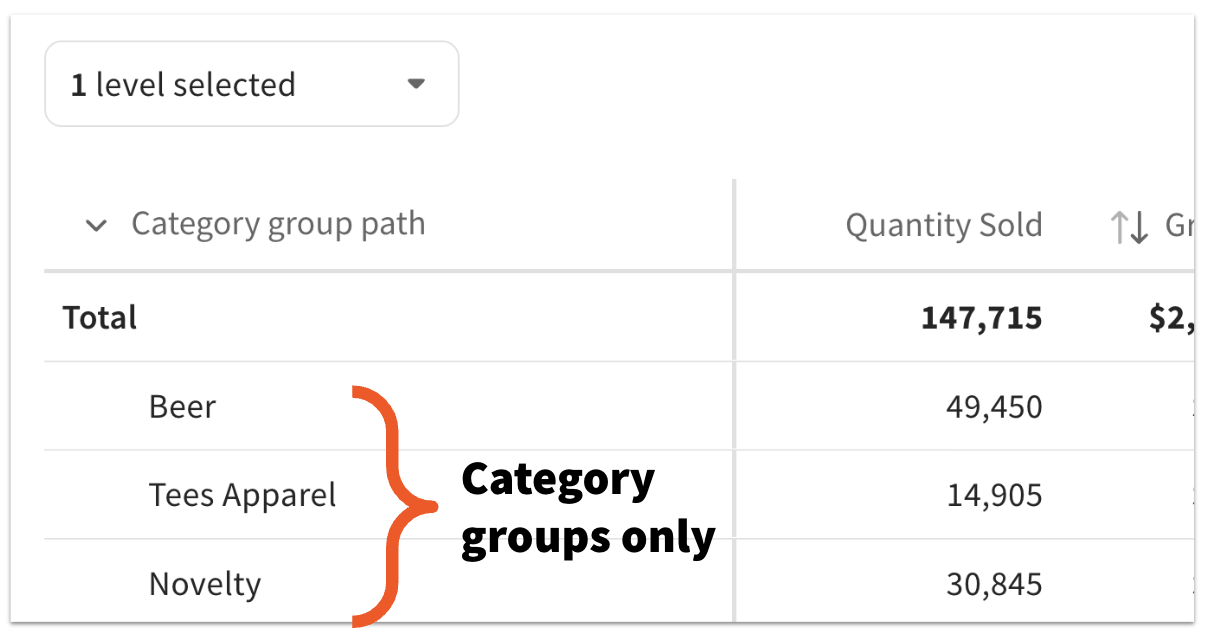
- Then, if you just select Category groups from the levels drop-down, you will simplify the table to only show data on the category group level:
- The Calculate by setting allows you to toggle between Landed cost and Base cost for your COGS, gross profit, and gross margin calculations. Landed cost is the default, and includes adjustments like taxes, fees, and discounts. Base cost reflects only the item's initial cost.
- The Columns button allows you to select, deselect, and rearrange the data that appears on the table. The options available include quantity sold, gross amount, discount amount, total taxes, net amount, COGS, gross profit, gross margin, barcode, Depending on your screen size, you may need to scroll to the right in order to see all of the selected columns. You can select a column header to sort your table in ascending or descending order.
To export the Sales & COGS report, select the download (down arrow) icon on the top right corner of the page. You’ll have the option to choose which items to include in your export (all items, or only visible items), which columns to include (all columns, or only visible columns), and whether you want to download your data in a CSV or Excel file.
Back to top
In order to see accurate COGS, gross profit, and gross margin calculations on your Sales & COGS report, you need to ensure you’re including cost data when making inventory adjustments.
Toast captures cost in two ways:
- The item cost is a single cost assigned to an item.
- This can be set when the item is initially created.
- This value is updated when cost values come in during the receiving process.
- This value is used in light cost estimates, such as the Inventory cost shown in the Item Library.
- This value is used as the default cost on retail reports when there isn’t a more specific lot cost for that quantity of inventory.
- Lot cost is tracked for quantities of inventory.
- This value is populated via the PO/Invoice during manual receiving.
- If a lot cost is provided for a quantity of inventory, Toast uses a first-in, first-out (FIFO) approach to assign the item cost at the time of sale.
- The lot costs for an item can be reviewed and adjusted in the Inventory adjustment history section of the item details page.
If either the item cost or the inventory cost field is missing for a particular item, then the calculations displayed on the report will be incomplete.
If you’re missing data, you’ll see a yellow banner at the top of the report, along with warning icons on the affected columns:
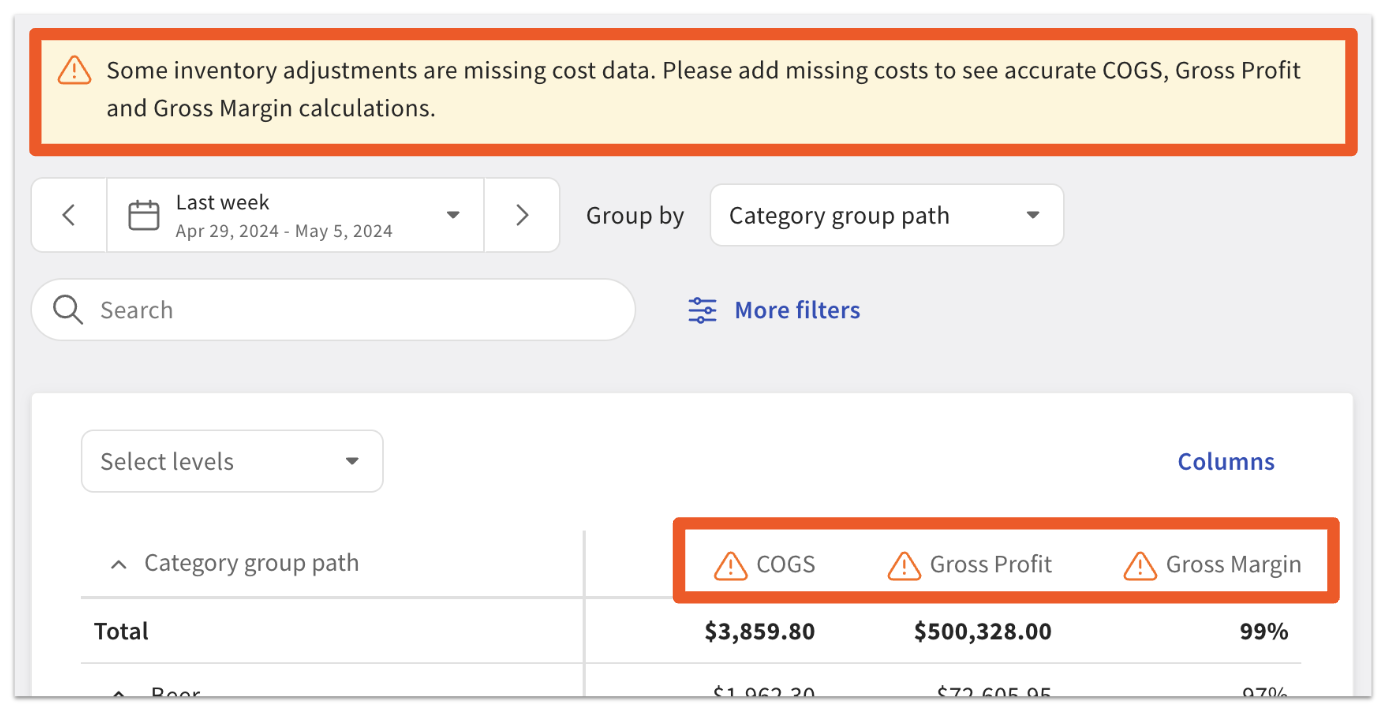
To learn more about how to correct this error, see the frequently asked questions section below.
Back to top
The Inventory Snapshot report provides you with moment-in-time inventory data for any date you select, and the Inventory Roll Forward report is designed to provide deep, granular insights into inventory adjustments within the Toast system. To learn more about these reports, see Toast Retail Inventory Reports.
Back to top
You can also use the following configurations to view data about your retail items in the existing reports on Toast Web:
- Sales Categories: Creating a “Retail” sales category is an easy way to group items to see a quick overview in the Sales Summary report. Sales categories can be applied at the category group (menu) level to apply to every item from that category group when they appear in your item library.
- For businesses using Toast Multilocation Management (MLM), the highest resolved sales category will show on your item details page, even if there are versions.
- Categories and subcategories: Your retail categories and subcategories (the menu group and menu subgroup) can help you see separate totals in your reports for different groups of items. For example, you can create a category (menu group) for each of your suppliers if you’d like to see those totals in the Product Mix (PMIX) report.
- Menu item tags: You can use menu item tags for easier reporting that doesn’t involve changing your organizational structure. Assign the tags that apply to your retail items, and then you can filter the PMIX report based on those item tags. Learn more in this Toast Central article: Use Menu Item Tags to Maximize Reporting.
Back to top
COGS can be calculated when an item has an inventory cost associated with it. If you’re missing COGS data, take the following steps to correct the issue:
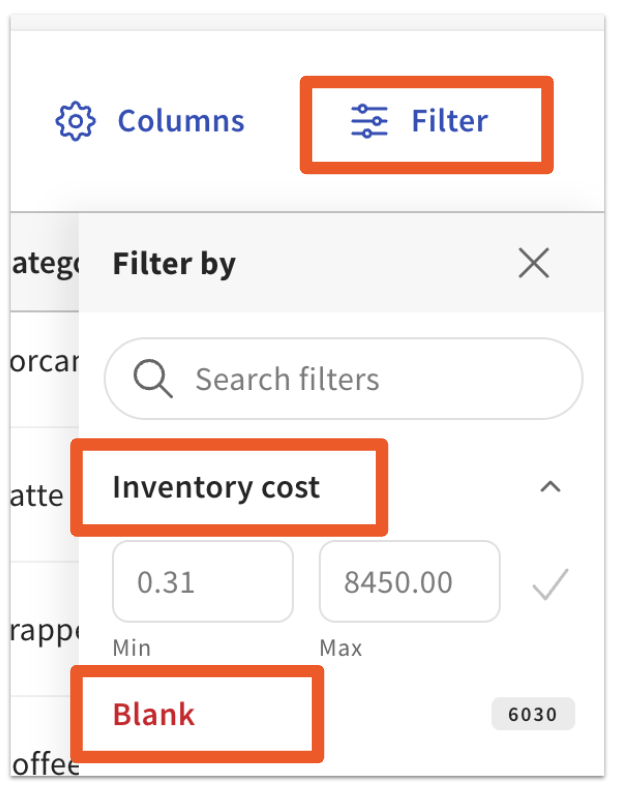
- In Toast Retail, navigate to Item management > Item Library.
- Select Filter, scroll down to Inventory cost, and select Blank to show all items with a blank inventory cost field.
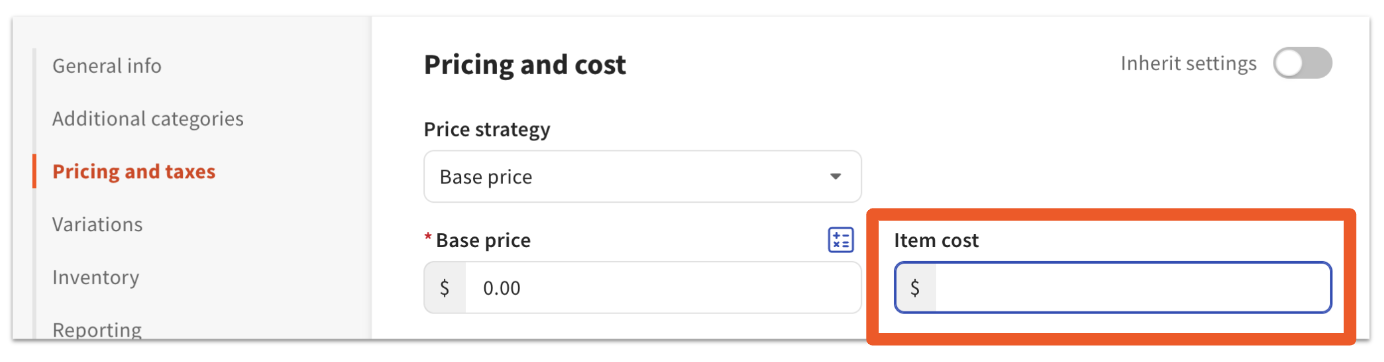
- To populate a value in the inventory field, you’ll need the item’s quantity in stock as well as the cost of the item associated with that quantity. Select the item name to open the item details page.
- In the Pricing and cost section, under the Pricing and cost settings, ensure there’s a value entered for Item cost.
- In the Inventory section, ensure that Track is toggled On. If Inventory on hand is showing as “zero”, select Adjust to enter your quantity in stock.
- Save your changes and repeat for other items without inventory cost.
COGS data doesn't rely on inventory quantity available; it is based on quantity sold. Enabling inventory tracking on the item settings page (as described in step 5) will show COGS information on the report. COGS data will not update for past dates when you first enable this setting.
Any corrections to your inventory cost values will be updated on all reports for previous days. To ensure that the data remains accurate, be sure to always enter an updated cost when receiving stock.
No, at this time Toast Retail will only show sales data for the location that you’re logged into. Reports for each location can be downloaded individually and then compared using a spreadsheet tool like Google Sheets or Excel.
The data on your Sales & COGS and Inventory Snapshot reports is recalculated overnight, which is why it might not match your PMIX data exactly.
Why are there negative quantities in my Inventory Snapshot Report?
If items have a barcode and Track Inventory is enabled, inventory counts can go negative when scanned. When inventory starts with a low count (including zero), continued scanning will push the count below zero once inventory is depleted. This setup prevents overcounting by allowing for accurate adjustments when products are received but not immediately checked in.
To reconcile the negative quantity, perform a cycle count or receive inventory. If you no longer wish to track inventory quantities for an item, performing a cycle count to set the item's inventory quantity bzero before disabling inventory tracking is recommended. This action will reset the quantity to zero for accurate reporting.
No, currently, there is no way to see cost history unless you've been using the receiving workflow and updating costs upon receiving. Those costs are held within the item's inventory history on the item details page.
Back to top
Back to top